HELPS Plancha Tests and Ron Larson's Q&A
Don O'Neal HELPS International March 2003
|
|
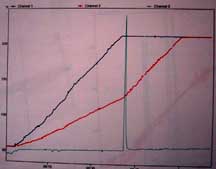
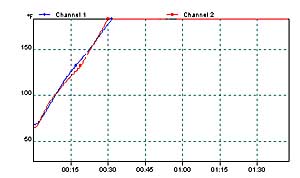
The curves show the heating rate on the front and rear pot holes. The rate of heating on the back pot hole is about half that of the front. At the green marker spike, the front pot starts to boil and the pots are reversed. Back to front and front to back. The boiling pot, now on the back pot hole continues to boil and the cooler pot, now on the front, starts to heat at a rate approximating the original front pot. The women seem to prefer a hotter area and a simmering area. In fact there was little problem with this configuration until the ladies tried the 'Jutiaupa Mod'.
Don's Response to Ron Larson's Questions (Mar 28 2003)
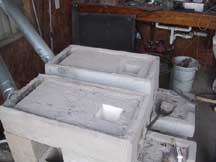
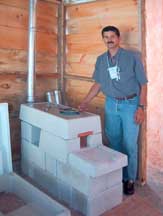
The test setup.
1. Two cast concrete stove bodies. One with a 1/4" welded steel plancha the other a cast-iron plancha. The planchas both had a 8" front pot hole and a 6" back pot hole. (note: later tests increase the hole size to 10" on both front and back holes in the sheet steel plancha.)
2. Two identical pots. A standard of 3 gal. of water was selected to give heating times long enough to average out small variation in wood burning rates. The pots were new, 11" in diameter, stainless steel with lids. Wood was oak.
3. A computer with three thermocouples, type K. monitored the pots. Holders inside the pots held the thermocouples in identical locations, 1" off the bottom. The thermocouple instrumentation was Pico TC-08 with real time plotting software. Samples were automatically taken every ten seconds.
In looking at the curves, I use the following terminology.
Phase one-- The lighting. Small sticks starting to burn and ignite larger sticks. It is significant that the length of this can vary with the elbow temperature. No appreciable heating of the water occurs. This causes a flat line indication on the graph.
Phase two--During this phase the elbow is coming up to temperature, indicated by a curved heating rate. The heating rate increasing as the elbow approaches operating temperature.
Phase three.--The elbow has stabilized its temperature. The curves then shows a linear rate of rise. The heating rate will depend on the stove design.
Ron's Questions:
Q1. Don - These straight line curves would tell us a lot about efficiency if we knew the rate of fuel consumption (kg/hour or g/min). Do you have any such information?
No, these test were run in 2000. But I think there is significance in the straightness on the curves.
 |
 |
 |
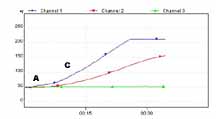
In the curve on the left, the portion from:
1. Start to point A is phase one.
2. From A to C is phase two
3. From C on is phase three
This is just my private terminology
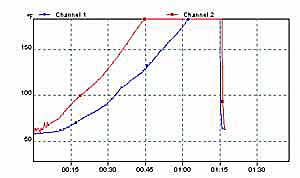
The middle curve is two stoves side by side one (the red curve) with a commercial, insulating fire brick combustion chamber. The other is a cast Iron combustion chamber with 1/4 wall thickness, very high mass. Both stoves are started simultaneously with identical loads of wood (close as possible). Oak wood and 3 gal.(sorry about the units) of water. The fire brick showed little phase one and only slight phase two time. The cast iron has longer phase one time. It also had a longer phase two, almost 30 minutes. The right curve shows both stoves from a hot start. Once hot, the cast iron was identical to fire brick. Both were backed up with ash insulation.
The significance is the straightness of the heating rate once phase three has been achieve. There is no way my fire tending was as constant as the heating rate. Once there is enough wood burning, more seems to add little to the transfer. This leads me to believe that the pot transfer characteristics sets a maximum on the heating rate and additional wood just lowers efficiency. I'll leave that to the researchers to comment on.
Cold cast iron chills the start up causing a longer phase one and phase two.
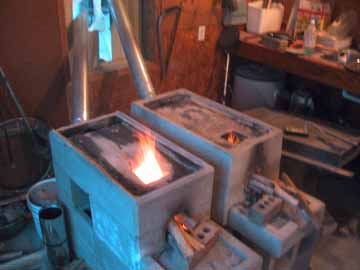 |
Both stoves (plancha removed) started at the same time with same conditions except the one in back had a cast-iron combustion chamber the closer one had the insulative firebrick. Both performed identically once up to temperature.
Q2. You talk about "holes" below - but I have an image of pots sitting on the plancha. Can you tell us more about diameters and amounts of waterand how deep they penetrate the plancha if there is penetration
 |
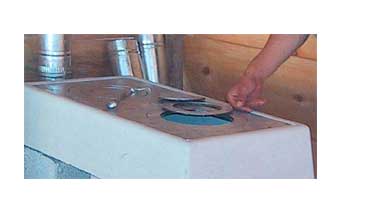 |
There are two pot holes, one behind the other. Each hole has two rings and a inner cover. The pot sits 'on' the plancha but the inner cover and rings are removed to expose much of the pot bottom directly to the hot gases. This is also a benefit for rounded bottom pots like clay pots etc.
Q3. Also tell us more about the pots (steel?, iron, aluminum?, weight, height, diameter) and covering with lids (picking up another theme of recent days). Could you readily run such curves alternating between lids and no lids? The use of such nice straight lines is very informative.
Anything special to say about your two temperature probes?
My test pots are stainless steel 11" in dia. In the field it is anything they can find.
I have run 'lid on and off tests' and find that if there is sufficient fire there is little difference. If the fire is marginal, just below the straight heating rate line, then there is a roll off of the slope as the water approaches boiling(due to evaporation cooling). At lower temperatures the curves track lids on or lids off. If there is a hot fire they track all the way to boiling.
I run test with lids on. I have these curves but can't locate them at the moment.
Regards
DON