2.1 Study of the biomass sources
2.1.2 Calorific value and
emissions of sawdust’s SFB
2.1.4 Sawdust’s collection
system
2.2 Acceptability of the technology
2.2.2 Health impact
assessment
2.3.1. Definitive SFB cost
sheet
2.3.2 Comparison with other
alternatives fuels
2.3.3. Potential for
technology optimizing
ANNEX 1: Smoke Analysis.
Kitchen 1: VICLAR enterprise Santa Clara
ANNEX-2: Smoke and Calorific
Value analysis. Kitchen 2: EPP-4. Santa Clara
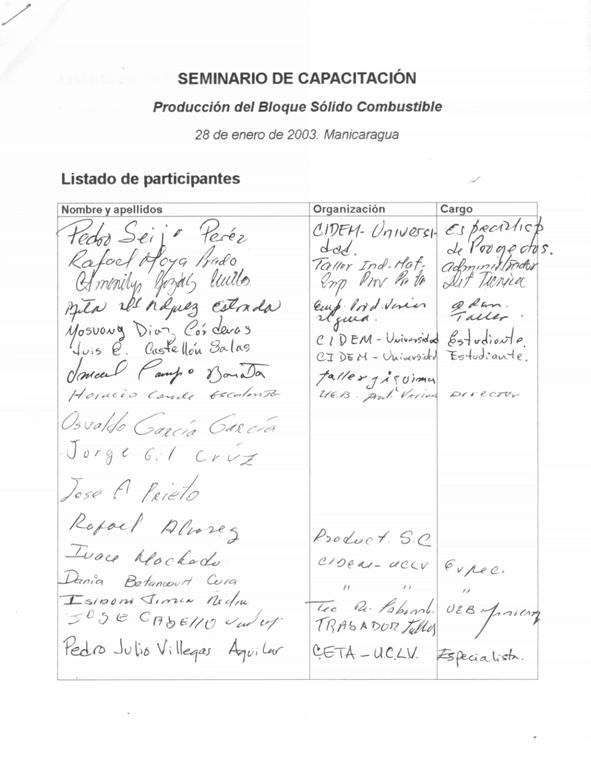
ANNEX 5: List of participants. SFB seminar. Manicaragua, 28 January 2003
Prepared by: Dr. Fernando Martirena H.
Ing. Iván Machado López
Ing. Pedro Seijo Pérez
Ing. Raul González
Institution: CIDEM, Cuba
E-mail: F.Martirena@enet.cu
Biomass
briquetting is usually an energy-intensive process. Large screw-type presses
are used, and the end product has a high density that makes its manipulation
easier. However, investment and operational costs for this type of process are
far out of the reach of the poor.
Bearing this in
mind CIDEM devised a system to attain low-pressure compaction with a simple
hand press, similar to the one used to manufacture Earth-Compressed-Blocks. The
disadvantage is that biomass must be previously mixed with a binder, in this
case clay, in order to reach the desired density. The Solid Fuel Block is the
end product.
This technology
has been introduced in Cuba at pilot scale. There are currently two workshops
in full operation at Villa Clara province; both of them are tapping the cooking
fuels market at popular kitchens by replacing the scarce and ecologically
unfriendly firewood. Also, there are some attempts to use the SFB to replace
firewood in the manufacture of building materials, basically fired clay bricks
and quicklime.
The present
report describes the studies carried out to assess the impact of the technology
in all stakeholders involved. The report will focus on the potential of the new
product in the open market and sustainability of its manufacture in the local
context.
2. Impact of the technology
2.1 Study of the biomass sources
As the project
aims at implementation in urban and suburban areas, the main source of biomass
available is sawdust –besides solid urban wastes-. Therefore most of the
studies will focus in such material
The study shows that there is a great potential in the use of sawdust as waste product for the manufacture of SFB. The sawdust is produced at both sawmills and carpentries. Table 1 lists the places surveyed.
Table 1: Identification of the different sawdust sources
|
Identification of the facility |
Sawdust/year (m3) |
|
A
:- Saw mill FERMENCO; Santa Clara. |
815 |
|
B
:- Saw mill CASCAJAL; VC |
367 |
|
C :-
Saw mill MANICARAGUA; VC |
495 |
|
D
:- Saw mill CPA MANICARAGUA; VC |
122 |
|
E
:- Saw mill CUBA-PARK; Placetas,VC |
545 |
|
F
:- Saw mill JIBACOA; VC |
122 |
|
G :-
Saw mill CPA Ovidio Rivero; VC |
18 |
|
H
:- Carpentry Poder Popular Sagua la Grande, VC |
15 |
|
I :-
Carpentry LA CAMPANA; VC |
14 |
|
J:-
Carpentry MICONS; |
22 |
|
TOTAL |
2535 |
The total estimated yearly sawdust production is in the range of 2535 m3 (405 ton); however, there are differences between the type and characteristics of the material, depending on where and from what it is produced. The main types of sawdust referred are:
1. Sawdust produced directly at sawmills when the wood is processed.
2. Sawdust produced at carpentries when timber is processed
3. Shopped wood produced while processing timber at carpentries
Figure 1
presents the different types of sawdust, and their proportions. As expected,
the largest share of material comes from the sawmills as coarse sawdust
resulting from wood processing. The amount of shopped wood is insignificant
compared to the two other types, however regarding it could be important, since
it helps increasing handling strength of the SFB.
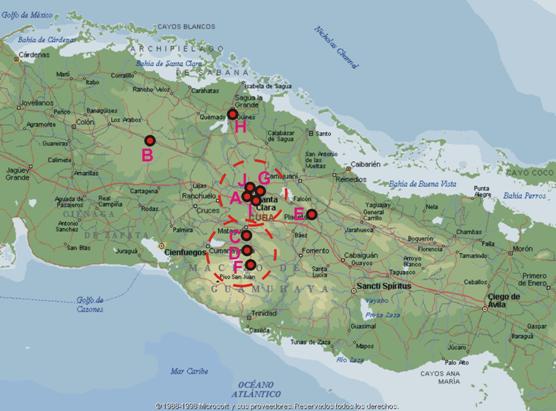
Figure 2: Main sources of sawdust at Villa Clara province
Fig. 2 presents the distribution of the main sources of sawdust at Villa Clara province. There are four zones clearly defined where most of the sawdust production is concentrated:
a) Near the industrial centers at Santa Clara city: the wood is brought to be processed at the sawmills that operate directly on the city grid.
b) At the Escambray mountains, near Manicaragua, where the wood is processed directly at the forest areas.
c) At Placetas where large sawmill processes wood coming from the mountains.
d) At Cascajal, where a large sawmill processes wood coming from the west of the country.
Fig 3 presents the sawdust generations in the described regions at Villa Clara province. As seen, the sawdust production is evenly distributed among the main four regions. The amount of sawdust produced per year in each of the described regions is enough to hold a steady production at least at one of the SFB workshops.
Bearing this in mind, the logical decision making as per setting up a SFB workshop should be:
· First step (pilot scale): Santa Clara and/or Manicaragua
· Second step (further dissemination): Placetas or Cascajal
The project’s decisions actually followed the above-described criteria. The first workshop was set at Santa Clara city in September 2002, with a total sawdust availability of 860 m3 per year. The sawdust sources are located in a radius of 1.5 km from the workshop, thus making it possible transportation in three wheeler bicycles or even horse carriages.
The second workshop was located on January 2003 at the outskirts of the town Manicaragua, a couple of hundred meters away from the main source of sawdust, thus making it even easier to source the sawdust. Both workshops (Santa Clara and Manicaragua) are in experimental production.
2.1.2 Calorific value and emissions of sawdust’s SFB
The tests were
performed by a team of experts of CETA (Center for Thermo Energetic Studies) at
the Central University of las Villas. The main studies were:
1.
Immediate
analysis: this included
moisture, according to ASTM D-3175-73; Volatiles, according to ASTM D-3175-77;
Ashes, according to ASTM D-3174-73; and Fixed carbon.
2.
Elementary
analysis: it aimed at determining the percentages of
carbon, hydrogen, nitrogen, sulfur and oxygen in each of the sampled burning.
3.
Calorific
Value: it was estimated on the
basis of the method proposed by Cukierman et al[1] for the SFB, and the
mixtures of SFB and firewood as well.
The main
equipment used for the experimental measurements was:
1.
Gas
analyzer RBR-ECOM-SG PLUS: it
is an electronic equipment that permits simultaneous determining of oxygen,
carbon dioxide and monoxide, nitrous oxides, sulfur dioxide, and both the room
temperature and the exhaust gas temperature.
2.
Digital
thermometer Kane Maye: to
measure the exhaust gas temperature separately.
The tests were
carried out in two different facilities, as listed below:
·
Kitchen
1: VICLAR enterprise, Santa Clara: it is a kitchen that attends approximately 200 people working on
VICLAR. They basically cook lunch. The evaluation was done during September
2001, and focused mainly on emissions (see report phase 2)
·
Kitchen
2: EPP-4, Santa Clara: it is a
kitchen that attends 150 people, basically for lunch services. The evaluation
was done on January-February 2003, and focused on emissions, calorific value
and air quality.
The results of
both testing are included in the annexes of this report. Table 2 presents the
results of the tests carried out in kitchen 2, mainly the immediate and
elementary analysis, as well as calorific value and apparent density.
Table 2: Immediate and elementary analysis, calorific value and apparent density
of the tested samples.
|
Sample |
% W |
%Vv (lh) |
%Cf (lh) |
%A (lh) |
%C (lhc) |
%H (lhc) |
%O* (lhc) |
%N (lhc) |
dap (g/ml) |
PCS (kJ/kg) |
|
Clay |
||||||||||
|
Average
value |
7.12 |
5.86 |
0.23 |
93.91 |
- |
- |
- |
- |
1.113 |
- |
|
Sawdust |
||||||||||
|
Average
value |
15.06 |
90.90 |
8.72 |
0.38 |
43,13 |
6,21 |
49,44 |
1,22 |
0.166 |
17983 |
|
Solid Fuel Block |
||||||||||
|
Average
value |
13.04 |
81,54 |
7.46 |
11.00 |
48,46 |
5,69 |
44,75 |
1,10 |
2.161 |
18485 |
Legend:
W: moisture
Vv: volatile
Cf: Fixed carbon
A: Ashes
lh:
free of moisture
lhc:
free of moisture and ashes
*
Determined by difference.
The tests
confirm the high calorific value of the SFB, comparable to that of the sawdust
alone. This indicates that the presence of clay does not significantly
influence its fuel properties. The results of the tests were also visually
confirmed while watching the burning of the SFB directly at the stoves.
Table 3
presents the average results of the analysis of the emissions in the evaluated
samples. The study aimed at comparing the different burning conditions that
occur when firewood is burnt alone or with different SFB proportions, and also
when the SFB are burnt alone. The results reflect that similar burning
conditions occur regardless the combination SFB / firewood, which means that
the SFB burns basically similar to regular firewood.
Every time the
solid fuel is fed to the burning chamber, the gas temperature decreases. This
brings about an increase in CO and O2 concentrations, since it
apparently the drag of the chimney cannot cope with the sudden increase volume
of gas produced. Shortly after, when the stove begins to work in stable regime,
the gas temperature rises, and the CO and O2 concentrations are
significantly lowered. During SFB combustion the CO concentration was always
slightly higher than in other cases, which probably indicates an incomplete
burning, because of excessive water content in the blocks. It is therefore
recommended to dry the SFB further, in order to attain a complete burning.
Table 3: Analysis of exhaust gas emissions during combustion
|
Experiment |
Room T (°C) |
Gas T (°C) |
O2 (%) |
CO2 (%) |
CO (ppm) |
NO (ppm) |
NO2 (ppm) |
NOx (ppm) |
SO2 (ppm) |
|
Firewood alone |
|||||||||
|
Exp. 1 |
29 |
249 |
14.2 |
6.6 |
1 439 |
59 |
0 |
59 |
0 |
|
Exp. 2 |
30 |
381 |
13.7 |
7.1 |
1 624 |
60 |
0 |
60 |
0 |
|
Exp. 3 |
30 |
427 |
14.0 |
6.8 |
1732 |
58 |
0 |
58 |
0 |
|
Exp. 4 |
31 |
256 |
16.8 |
3.6 |
5 861 |
38 |
0 |
38 |
0 |
|
Exp. 5 |
29 |
293 |
16.7 |
4.0 |
2 475 |
41 |
0 |
41 |
0 |
|
Exp. 6 |
29 |
324 |
13.5 |
7.4 |
415 |
71 |
0 |
71 |
0 |
|
Exp. 7 |
30 |
480 |
14.4 |
6.5 |
444 |
61 |
0 |
61 |
0 |
|
Firewood + SFB |
|||||||||
|
Exp. 8 |
31 |
383 |
16.1 |
4.7 |
1 911 |
39 |
0 |
39 |
0 |
|
Exp. 9 |
30 |
351 |
18.0 |
2.6 |
3 841 |
33 |
0 |
33 |
0 |
|
Exp. 10 |
30 |
375 |
17.6 |
3.0 |
3 665 |
36 |
0 |
36 |
0 |
|
Exp. 11 |
29 |
450 |
16.6 |
4.1 |
2 443 |
33 |
1 |
34 |
0 |
|
Exp. 12 |
30 |
435 |
16.8 |
3.9 |
2 828 |
32 |
1 |
33 |
0 |
|
SFB alone |
|||||||||
|
Exp. 13 |
30 |
338 |
18.3 |
2.3 |
3 217 |
24 |
0 |
24 |
0 |
|
Exp. 14 |
29 |
314 |
18.7 |
1.9 |
3 350 |
23 |
0 |
23 |
0 |
|
Exp. 15 |
31 |
277 |
19.1 |
1.5 |
3 361 |
22 |
0 |
22 |
0 |
|
Exp. 16 |
30 |
401 |
17.6 |
3.2 |
1 894 |
30 |
0 |
30 |
0 |
|
Exp. 17 |
30 |
398 |
17.7 |
3.1 |
1 904 |
30 |
0 |
30 |
0 |
|
Exp. 18 |
29 |
411 |
17.2 |
3.5 |
2 089 |
34 |
0 |
34 |
0 |
|
Exp. 19 |
30 |
326 |
17.7 |
2.9 |
3 217 |
25 |
0 |
25 |
0 |
|
Exp. 20 |
31 |
344 |
16.7 |
3.9 |
3 648 |
20 |
0 |
20 |
0 |
|
Exp. 21 |
30 |
369 |
16.4 |
4.4 |
1 137 |
24 |
0 |
24 |
0 |
The sawdust is
basically a waste product, and most of the facilities where it is produced do
not charge for supply. There are, however, two sawmills at Santa Clara
(Fermenco and La Campana) that charge $10/m3 (Cuban pesos[2]) for eventually supplying
the material.
It is foreseen
that in the near future, and mainly because of this project, sawdust producers
will realize the importance of this material and will start selling their
product, which no longer be considered a waste, but a valuable good.
2.1.4 Sawdust’s collection system
The collection
system has to be studied in close connection with the closest source of sawdust
at the workshop. Three transportation possibilities were evaluated:
1.
Three-wheeler
bicycle: the model available
at the local market enables to carry up to 9 sacks of compacted sawdust, each
weighing 33.7 kg.
2.
Horse
carriage: it is a very popular
and relatively cheap transportation means. An average size carriage enables
transport of 20 sacks of compacted sawdust, each weighing 33.7 kg.
3.
5 ton
truck: it should be the most
expensive of all the alternatives, however for longer distance its use could be
justified. A full truck can carry up to 100 sacks of compacted sawdust, each
weighing 33.7 kg.
Table 4: Transportation analysis, workshop at Santa Clara
|
Three-wheeler cycle |
|
|
|
|
|
|
|
Needed
trips/d |
Needed sacks/d |
Sack/trip |
Kg/trip |
Speed (km/h) |
Distance (km) |
Time (min) |
|
1.44 |
13 |
9 |
336.6 |
20 |
1.5 |
39 |
|
|
|
|
|
|
|
|
|
Horse carriage |
|
|
|
|
|
|
|
Needed
trips/d |
Needed sacks/d |
Sack/trip |
Kg/trip |
Speed (km/h) |
Distance (km) |
Time (min) |
|
0.65 |
13 |
20 |
748 |
20 |
1.5 |
54 |
|
|
|
|
|
|
|
|
|
Diesel truck 5 ton |
|
|
|
|
|
|
|
Needed
trips/d |
Needed sacks/d |
Sack/trip |
Kg/trip |
Speed (km/h) |
Distance (km) |
Time (min) |
|
0.13 |
13 |
100 |
3740 |
30 |
1.5 |
61 |
Tables 4
presents the different transportation options for the workshop at Santa Clara.
Table 5 provides the same information for the workshop at Manicaragua. The
approximate need of sawdust for the daily output of the workshop (200 blocks,
each weighing approximately 1 kg) is 13 33.7 kg sacks. The analysis of the
figures reflects:
·
That every
second day the three-wheeler should complete 3 round trips.
·
That
approximately the horse carriage should have to do 3 trips per week.
·
That every
nine days a truck trip could be organized.
Table 5: Transportation analysis, workshop at Manicaragua
|
Three-wheeler cycle |
|
|
|
|
|
|
|
Needed
trips/d |
Needed sacks/d |
Sack/trip |
Kg/trip |
Speed (km/h) |
Distance (km) |
Time (min) |
|
1.44 |
13 |
9 |
336.6 |
20 |
1 |
36 |
|
|
|
|
|
|
|
|
|
Horse carriage |
|
|
|
|
|
|
|
Needed
trips/d |
Needed sacks/d |
Sack/trip |
Kg/trip |
Speed (km/h) |
Distance (km) |
Time (min) |
|
0.65 |
13 |
20 |
748 |
20 |
1 |
51 |
|
|
|
|
|
|
|
|
|
Diesel Truck 5 ton |
|
|
|
|
|
|
|
Needed
trips/d |
Needed sacks/d |
Sack/trip |
Kg/trip |
Speed (km/h) |
Distance (km) |
Time (min) |
|
0.13 |
13 |
100 |
3740 |
30 |
1 |
59 |
Then the issues
“foreign currency costs” (associated with purchasing petrol), and “time” should
be weighed. The best option appears to be the three-wheeler bicycle, and
actually both workshops are equipped with such transportation means. However,
alternatives like horse carriages and 5-ton truck should also be evaluated in a
determined context. The cost analysis to be done further in this report will
give a few hints on the different alternatives.
2.2 Acceptability of the technology
In order to
complete the dissemination process, the acceptability of the product must be
assessed. The best way to do so was to implement a client survey among those in
connection either with the manufacture of the SFB or with the use of it.
Besides, a full health study was conducted in order to assess impact of the use
of the product on human health, basically because of the emissions.
The client
survey was done during the seminar with most of the producers and clients.
Table 6 presents the results of the processing of the survey. The results could
be summarized as:
·
Most of
the clients accept the current size and shape of the SFB. Some recommend making
it even bigger.
·
The great
majority of clients think that in its present shape the block is light and can
be easily handled.
·
There are
crossed opinions about the price. It appears to be some disagreement with the
present price.
·
The great
majority of clients think that the SFB burns relatively good. Most of them also
think that it burns better than firewood.
·
The SFB is
seen as a cheaper alternative in comparison with firewood
·
They agree
that the SFB is the easiest fuel to handle with.
Table 6: results of the client’s survey
|
About the product Solid Fuel Block |
|
|
|
|
|
|
|
|
|
|
|
Answer 1 |
# |
% |
Answer 2 |
# |
% |
Answer 3 |
# |
% |
|
Size
is OK? |
Yes |
9 |
75% |
No |
1 |
8% |
|
|
|
|
If
negative, should it be? |
Bigger |
7 |
58% |
Smaller |
|
0% |
|
|
|
|
Is
it too heavy? |
Yes |
0 |
0% |
No |
10 |
83% |
|
|
|
|
Is
it easy to handle? |
Yes |
11 |
92% |
No |
|
0% |
|
|
|
|
Your
opinion about the current price |
OK |
3 |
25% |
Lower |
|
0% |
Higher |
2 |
17% |
|
|
|
|
|
|
|
|
|
|
|
|
About the
use of Solid Fuel Block |
|
|
|
|
|
|
|
|
|
|
|
|
|
|
|
|
|
|
|
|
|
How
does it burn? |
Good |
10 |
83% |
Middle |
1 |
8% |
Bad |
|
|
|
In
comparison to firewood it is? |
Better |
8 |
67% |
Same |
1 |
8% |
Worse |
1 |
8% |
|
Does
it produce smoke? |
No |
1 |
8% |
Few |
9 |
75% |
A lot |
|
|
|
Costs
in comparison with firewood? |
+ expens. |
|
0% |
Same |
1 |
8% |
Cheaper |
8 |
67% |
|
Which
one is easier to work with? |
Firewood |
|
0% |
SFB |
9 |
75% |
Other |
|
|
2.2.2 Health impact assessment
The health
impact was assessed by means of measuring the quality of air of the zone where
the combustion was undertaken during 8 continuous days. For this experiment
kitchen 2 was selected, as they are the main customers for the SFB. In this
timeframe, various combinations of SFB and firewood were tested, included one
day where cooking was done only based on SFB supply.
This was done
with an air-monitoring kit. The process consists of monitoring the daily sulfur
concentration on the air through oxidation in a hydrogen peroxide solution 1%
and the particles of material present in the atmosphere mainly because to
incomplete combustion of the burnt material. Such material was collected
through a high-volume captor and the filters with micrometric pores that
correspond to each of the evaluated days that are further analyzed with a TVM
100 reflectometer.
The measurement
is based on the darkening of the filter in comparison with a non-exposed
filter, which has the advantage of retaining the black smokes from the emitter.
The progress of each of these parameters was daily analyzed, and the
concentrations were recorded in mg/m3 referred to the sampled air (1.5 –
2 m3 per day)
Figs. 4 and 5 present the results of the measurements done. The SFB were
burnt on day 5; notice that this day there was a slight increase on the
measured concentrations. As a rule, the quality of air in the studied area is
relatively good, since the determined concentrations are far below the
established limits.
The main factors that favor these low concentrations are: a) good wind
circulation, b) the area is far from the main industrial centers in the city.
The above-mentioned aspects allow us to conclude that no significant health
hazards are produced because of the shift from firewood to SFB in kitchen 2.
Fig. 4: Air
quality assessment: sulfur dioxide content
Fig. 5: Air
quality assessment: suspended particle content
Preliminary
estimates were done in order to assess the likely price for the new product.
After the continuous operation of both pilot workshops, these figures could be
fine tuned according to reality. This section presents the results of this
analysis.
2.3.1. Definitive SFB cost sheet
As done in the
previous phase, for the cost estimate only local currency was considered, since
hard currency expenses like diesel for transport are not necessary. The costs
of production are described below:
1.
Fixed
production costs: basically
include cost of indirect labor force, financial costs, transport, maintenance
and other costs. As the production is very simply organized, financial costs
are not considered in this analysis. This means they use their own financial
resources; therefore they do not need to go for bank loans.
2.
Variable
production costs: basically
include the cost of raw materials such as sawdust and clay, the cost of
commodities like water and electricity, and finally the cost of direct labor
force. All these costs have been set according to information provided by the
workshops.
3.
Profitability
margin: they usually assume it
as of 20% profit. This is relatively easy to achieve, since they have been
momentarily released from the production and sales taxes, as a means to
stimulate production of this environmentally friendly product.
According to the author of this report, the minimal price established for a SFB unit is $CUP 0.24 /kg. This could be expressed in mass as $CUP 240/ton or in volume as $CUP 38.4/m3 (for the accepted value 1 m3=160 kg).
There are,
however, problems with the price calculation done by the administration of the
workshop. Table 7 presents both cost schemes where the main differences can be
observed. The main problem found was the routine established to calculate the
indirect costs of the product, which leads to misinterpretations of the concept
of production. The indirect costs calculated by the administration are almost
twice as much as those estimated by the consultant, based on actual figures
provided by the workshop. This problem has to be addressed in the near future.
Table 7: Comparison between cost calculations
|
Concept |
Unit cost/official |
Unit cost/estim. |
Dif % |
|
Materials |
$ 0.00 |
$ 0.01 |
$
(0.01) |
|
Labor |
$ 0.16 |
$ 0.16 |
$
0.01 |
|
Taxes |
$ - |
$ - |
$
- |
|
Indirect
costs |
$ 0.08 |
$ 0.03 |
$
0.05 |
|
Total
cost |
$ 0.24 |
$ 0.19 |
$
0.05 |
|
Profit
margin |
$
0.05 |
$ 0.04 |
$
0.01 |
|
Final
price |
$ 0.29 |
$ 0.24 |
$
0.05 |
The main cause
for the relatively high prices of the product is the low productivity of the
existing presses. Also, the workshop is operated by disable people, which have
a less demanding working schedule.
The
administration claims that every press is capable of producing up to 50 blocks
in an 8 hours journey. Practical observation of the production indicates that
every three minutes a block can be produced without special effort. This means
approximately 20 blocks per hour; 160 blocks per day, three times the amount
considered in this report.
2.3.2 Comparison with other alternatives fuels
The alternative
product traded in the market (firewood) is sold at approximately $CUP 58.8/m3.
Besides, the firewood has to be cut and brought to the workshop usually from
distance places. This requires a truck or a tractor, which means diesel or
petrol that has to be purchased in hard currency.
Table 8 presents
a cost comparison between the SFB and the current price of firewood. As seen, the price of SFB is approximately
33% lower than that of firewood. Besides, the manufacture of SFB does not imply
hard currency, as the transportation is organized with local means, and no
petrol is therefore needed.
Table 8: Cost comparison with firewood
|
Firewood Price x m3 |
SFB minimal scenario |
||
|
Price x m3 |
Price x
unit |
Days
for BEP |
|
|
58.80 |
39.06 |
0.24 |
18 |
There are
significant differences with the estimations of unit weight of the SFB and the
actual weight, which reflect in apparent contradictions in the comparison,
since the cost difference still remains although the prices of the SFB has
almost tripled.
The most
important thing is that firewood is provided at the cost of depleting the
tropical forests in Cuba, and the SFB is an environmentally friendly product,
whose manufacture implies recycling of waste materials and job creation.
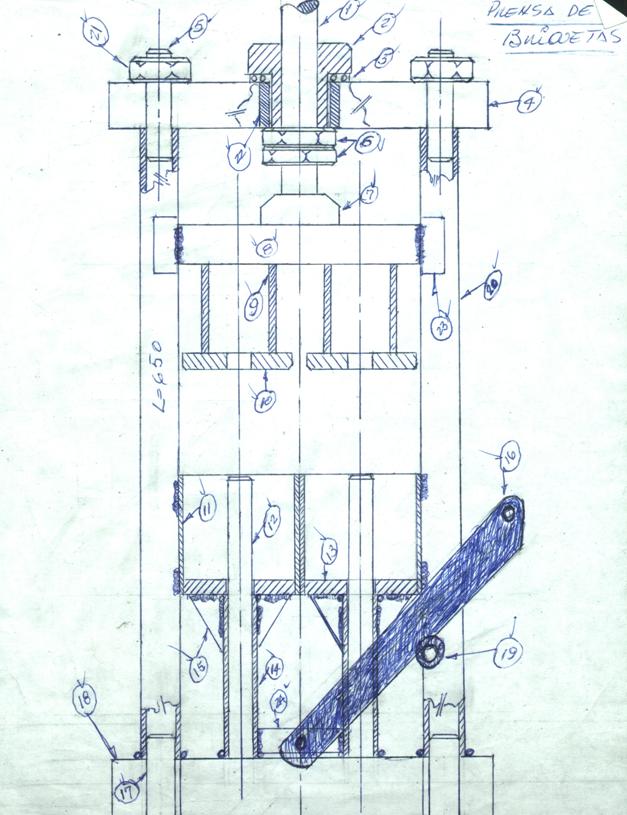
2.3.3. Potential for technology optimizing
The optimizing of
technology has to pass through the design of the hand press. The output has to be increased, and the force
to be exerted while pressing decreased.
There are current
design improvements underway (see annex 4). The new press presses two units
simultaneously; this allows to automatically doubling the output. The thread of
the piston is designed in a way that the movement of the piston upwards and
downwards is faster as in the original model. Besides, the lever to exert the
force to the piston is longer; therefore less force is needed in order to
attain the same pressure. This makes the new design gender sensible.
The final
tuning of the technology, as well as the start of the dissemination was carried
out through a seminar. The event was held on January 28th, 2003, at
the workshop at Manicaragua. In total, 17 persons participated (see Annex 5),
most of them from the workshops in Santa Clara and Manicaragua; also some of
the potential clients, which were curious to see the performance of the new product.
The goal of the
seminar was to train producers in the use of the technology; also to show
potential clients the features of the new product. Practical SFB manufacture
was organized as part of the workshop, as well as trial burning of some of the
recently produced SFBs.
The impact
assessment showed that the technology for the SFB manufacture could likely be
implemented in Cuba with great success. The manufacture process is friendly
enough; the product has relatively good acceptability among producers and
potential clients, and competes with advantages with the alternative fuel
available: firewood.
The following table presents the
mean values of the results of the different analysis carried out.
|
Time |
Troom (°C) |
Tgas (°C) |
O2 (%) |
CO2 (%) |
CO (ppm) |
NO (ppm) |
NO2 (ppm) |
SO2 (ppm) |
Effic. (%) |
|
02:47 |
33 |
120 |
19.5 |
1.5 |
18 850 |
358 |
0 |
0 |
50 |
|
02:48 |
33 |
117 |
20.0 |
1.0 |
16 808 |
414 |
0 |
0 |
50 |
|
02:51 |
33 |
129 |
19.6 |
1.4 |
14 889 |
280 |
0 |
0 |
50 |
|
02:53 |
33 |
137 |
19.1 |
1.9 |
14 686 |
239 |
0 |
0 |
50 |
|
02:55 |
32 |
123 |
19.6 |
1.4 |
27 412 |
428 |
0 |
0 |
40 |
|
02:56 |
32 |
129 |
19.0 |
2.0 |
13 299 |
258 |
0 |
0 |
50 |
|
03:11 |
30 |
117 |
19.9 |
1.1 |
25 195 |
376 |
0 |
0 |
40 |
|
03:16 |
29 |
110 |
20.0 |
1.0 |
41 151 |
600 |
0 |
0 |
40 |
|
03:17 |
29 |
115 |
19.8 |
1.2 |
24 305 |
448 |
0 |
0 |
40 |
|
03:21 |
31 |
129 |
19.7 |
1.3 |
19 187 |
318 |
0 |
0 |
45 |
|
03:22 |
31 |
125 |
20.0 |
1.0 |
39 226 |
455 |
0 |
0 |
40 |
These figures allow us to establish some interrelations between the evaluated parameters, as illustrated in the following graphics.
Dependency between the CO concentration and the gas temperature during SFB combustión.
Dependency between the NO concentration and the gas temperature during the SFB combustion.
Dependency between the O concentration and the gas temperature during the SFB combustion
The following table presents the results of the experiments: immediate
and elemental anaysis, calorific value and apparent density.
|
Sample |
% W |
%Vv (lh) |
%Cf (lh) |
%A (lh) |
%C (lhc) |
%H (lhc) |
%O* (lhc) |
%N (lhc) |
dap (g/ml) |
CV (kJ/kg) |
|
Clay |
||||||||||
|
Experiment
1 |
7.10 |
5.83 |
0.23 |
93.94 |
- |
- |
- |
- |
1.114 |
- |
|
Experiment
2 |
7.05 |
6.07 |
0.13 |
93.80 |
- |
- |
- |
- |
1.112 |
- |
|
Experiment
3 |
7.20 |
5.67 |
0.33 |
94.00 |
- |
- |
- |
- |
1.113 |
- |
|
Mean
values |
7.12 |
5.86 |
0.23 |
93.91 |
- |
- |
- |
- |
1.113 |
- |
|
Sawdust |
||||||||||
|
Experiment
1 |
14.50 |
88.55 |
11.02 |
0.43 |
44,46 |
6,08 |
48,27 |
1,19 |
0.168 |
18242 |
|
Experiment
2 |
15.22 |
91.33 |
8.00 |
0.67 |
42,88 |
6,23 |
49,66 |
1,22 |
0.167 |
17935 |
|
Experiment
3 |
15.47 |
92.81 |
7.13 |
0.06 |
42,04 |
6,32 |
50,40 |
1,24 |
0.163 |
17772 |
|
Mean
values |
15.06 |
90.90 |
8.72 |
0.38 |
43,13 |
6,21 |
49,44 |
1,22 |
0.166 |
17983 |
|
Solid Fuel Block |
||||||||||
|
Experiment
1 |
13.51 |
79,73 |
8.07 |
12.20 |
49,49 |
5,59 |
43,84 |
1,07 |
2.164 |
18799 |
|
Experiment
2 |
12.87 |
82,19 |
7.80 |
10.01 |
48,09 |
5,73 |
45,08 |
1,11 |
2.159 |
18382 |
|
Experiment
3 |
12.75 |
82,71 |
6.50 |
10.79 |
47,79 |
5,76 |
45,34 |
1,11 |
2.159 |
18275 |
|
Mean
values |
13.04 |
81,54 |
7.46 |
11.00 |
48,46 |
5,69 |
44,75 |
1,10 |
2.161 |
18485 |
The following table presents the mean values
of the results of the different analysis carried out. The study was done by
comparing and combining the different fuel alternatives
|
Experiment |
Room T (°C) |
Gas T (°C) |
O2 (%) |
CO2 (%) |
CO (ppm) |
NO (ppm) |
NO2 (ppm) |
NOx (ppm) |
SO2 (ppm) |
|
Firewood alone |
|||||||||
|
Exp. 1 |
29 |
249 |
14.2 |
6.6 |
1 439 |
59 |
0 |
59 |
0 |
|
Exp. 2 |
30 |
381 |
13.7 |
7.1 |
1 624 |
60 |
0 |
60 |
0 |
|
Exp. 3 |
30 |
427 |
14.0 |
6.8 |
1732 |
58 |
0 |
58 |
0 |
|
Exp. 4 |
31 |
256 |
16.8 |
3.6 |
5 861 |
38 |
0 |
38 |
0 |
|
Exp. 5 |
29 |
293 |
16.7 |
4.0 |
2 475 |
41 |
0 |
41 |
0 |
|
Exp. 6 |
29 |
324 |
13.5 |
7.4 |
415 |
71 |
0 |
71 |
0 |
|
Exp. 7 |
30 |
480 |
14.4 |
6.5 |
444 |
61 |
0 |
61 |
0 |
|
Firewood + SFB |
|||||||||
|
Exp. 8 |
31 |
383 |
16.1 |
4.7 |
1 911 |
39 |
0 |
39 |
0 |
|
Exp. 9 |
30 |
351 |
18.0 |
2.6 |
3 841 |
33 |
0 |
33 |
0 |
|
Exp. 10 |
30 |
375 |
17.6 |
3.0 |
3 665 |
36 |
0 |
36 |
0 |
|
Exp. 11 |
29 |
450 |
16.6 |
4.1 |
2 443 |
33 |
1 |
34 |
0 |
|
Exp. 12 |
30 |
435 |
16.8 |
3.9 |
2 828 |
32 |
1 |
33 |
0 |
|
SFB alone |
|||||||||
|
Exp. 13 |
30 |
338 |
18.3 |
2.3 |
3 217 |
24 |
0 |
24 |
0 |
|
Exp. 14 |
29 |
314 |
18.7 |
1.9 |
3 350 |
23 |
0 |
23 |
0 |
|
Exp. 15 |
31 |
277 |
19.1 |
1.5 |
3 361 |
22 |
0 |
22 |
0 |
|
Exp. 16 |
30 |
401 |
17.6 |
3.2 |
1 894 |
30 |
0 |
30 |
0 |
|
Exp. 17 |
30 |
398 |
17.7 |
3.1 |
1 904 |
30 |
0 |
30 |
0 |
|
Exp. 18 |
29 |
411 |
17.2 |
3.5 |
2 089 |
34 |
0 |
34 |
0 |
|
Exp. 19 |
30 |
326 |
17.7 |
2.9 |
3 217 |
25 |
0 |
25 |
0 |
|
Exp. 20 |
31 |
344 |
16.7 |
3.9 |
3 648 |
20 |
0 |
20 |
0 |
|
Exp. 21 |
30 |
369 |
16.4 |
4.4 |
1 137 |
24 |
0 |
24 |
0 |
|
COSTS |
|
|
|
|
Required external capital |
$ 5,760.00 |
|
|
|
Investment |
$ 5,160.00 |
|
|
|
Infrastructure |
$ 4,760.00 |
|
|
|
Equipment |
$ 400.00 |
|
|
|
|
|
|
|
|
Working capital |
$ 600.00 |
|
|
|
technical assistance |
$ - |
|
|
|
|
|
|
|
|
|
|
|
|
|
Description |
Costo Mens |
Cost Unit |
% |
|
Monthly fixed costs |
$ 277.67 |
$
0.03 |
14% |
|
Indirect work force |
$ - |
$
- |
0.0% |
|
Financial costs |
$ 6.67 |
$
0.00 |
0.4% |
|
Infrastructure |
$ - |
$
- |
0.0% |
|
Equipment |
$ 6.67 |
$
0.00 |
0.4% |
|
Initial costs |
$ - |
$
- |
0.0% |
|
Working capital |
$
- |
$
- |
0.0% |
|
Tools & Maintenance |
$
30.00 |
$
0.00 |
0.2% |
|
Transport |
$
240.00 |
$
0.03 |
13.7% |
|
Other fixed costs |
$ 1.00 |
$
0.00 |
0.1% |
|
|
|
|
|
|
|
|
|
|
|
Monthly variable costs |
$ 474.52 |
$
0.17 |
85.7% |
|
Raw materials |
$
24.77 |
$
0.01 |
4.5% |
|
Labor force |
$
449.74 |
$
0.16 |
81.3% |
|
Non-specialized |
$
- |
$ - |
0.0% |
|
Specialized |
$
449.74 |
$
0.16 |
81.3% |
|
Commodities |
$
0.01 |
$
0.00 |
0.0% |
|
|
|
|
|
|
Total production costs |
$ 752.19 |
$
0.19 |
100% |
|
|
|
|
|
|
SALES PRICE |
|
|
|
|
|
|
|
|
|
With planned profit |
$ 902.62 |
$
0.24 |
|
|
Variable costs |
$
474.52 |
$
0.17 |
|
|
Fixed costs |
$
277.67 |
$
0.03 |
|
|
Profit |
$
150.44 |
$
0.04 |
|
|
Sale tax |
$
- |
$
- |
|
|
Final
sale's price |
$ 902.62 |
$ 0.24 |
|